
What Is A Real Gas?
Real gases are non-ideal gases that deviate from the assumptions of the ideal gas law, which states that gas molecules do not interact and occupy no volume. In real gases, these assumptions are incorrect due to the finite volume of molecules and their intermolecular forces, especially under certain conditions like high pressure or low temperature.
Assumptions of Ideal Gases:
Real gases are non-ideal gases, where two assumptions from the ‘kinetic model’ are not accurate:
- Gas molecules/atoms occupy space,
- Gas molecules/atoms interact with each other.
At low pressures and high temperatures, these assumptions hold true, and gases behave ideally. However, at high pressures and low temperatures, the real behaviour of gases change due to molecular volume and intermolecular forces. The ideal gas law (see below) no longer accurately describes the system under these conditions.
Ideal Gas Equation

Equation 1: Ideal gas equation.
Where:
- P – Pressure (Pa),
- V – Volume (m3)
- n – Number of moles (mol),
- R – Ideal gas constant (J/mol·K),
- T – Temperature (K)
Limit P = 0, is when the assumptions work (Equation 1).
Ideal Gas Law Calculator
Factors Affecting Real Gas Behaviour
To understand the behaviour of real gases, the flowing must be taken into account:
- Compressibility effects
- Real gases can be compressed more or less than predicted by the ideal gas law.
- Variable specific heat capacity,
- Real gases do not have a constant specific heat capacity.
- Van der Waals forces,
- Attractive and repulsive intermolecular forces become significant, especially at high pressures.
- Non-equilibrium thermodynamic effects,
- Real gases may exhibit non-equilibrium behaviour, especially during rapid processes.
- Issues with molecular dissociation and elementary reactions with variable composition.
- In some conditions, molecules may dissociate or react, altering their behaviour.
The ideal gas approximation can be used with reasonable accuracy, however at certain conditions such as condensation point of gases, near critical points, at very high pressures, to explain the Joule–Thomson effect (the change in temperature that accompanies expansion of a gas without production of work or transfer of heat) and in other less usual cases, the real gas model would have to be used, with the deviation from ‘ideal’ conditions being described by a term called the compressibility factor, Z.
Compressibility Factor (Z)
The compressibility factor, Z, is the ratio of the measured molar volume of a real gas to the molar volume of an ideal gas at the same temperature and pressure (Equation 2). The compressibility factor is very useful for the modification of ideal gases into real gases, with deviations from ideal becomes more significant the closer the gas is to a phase change, the lower the temperature or larger the pressure.


Therefore, the compressibility factor is:

Equation 2: Compressibility factor equation and the molar volume equations for ideal and real gases.
The Behaviour of The Compressibility Factor (Z)
The compressibility factor generally increases with temperature and pressure, at low pressures Z = 1, which means the gas is ideal. At intermediate pressures Z < 1 and the molecules are free to move to result in attractive forces dominating and a smaller volume. At higher pressures, molecules are colliding more frequently which allows repulsive forces to have a noticeable effect resulting in a higher molar volume making Z > 1. Furthermore, the closer a gas is to its critical point or boiling point, the more Z will deviate from the ideal case (Figure 1).
• At low pressures, Z = 1
• At intermediate pressure, Z < 1
• At higher pressures, Z > 1
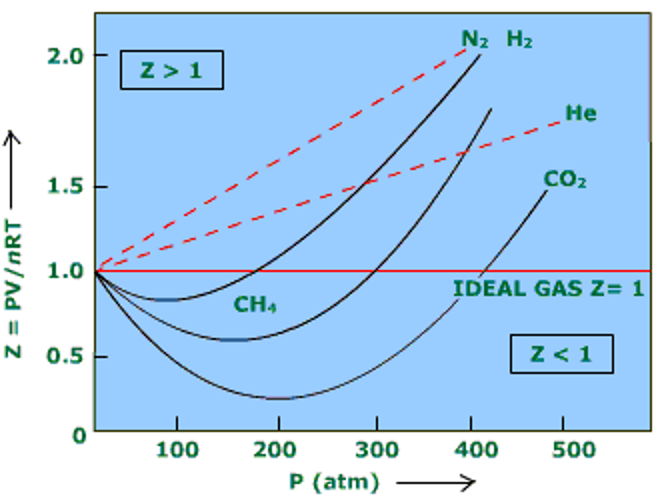
Figure 1: Compressibility Factor Graph (Stack Exchange, 2019).
Notice that, although the curves are approaching 1 as P = 0 they do so at different slopes.
Principle Of Corresponding States
The principle of corresponding states states that gases behave similarly at temperatures and pressures normalised relative to their critical temperature (Equation 3) and critical pressure (Equation 4) where gases transition between liquid and gas phases.

Equation 3: Critical temperature equation.

Equation 4: Critical pressure equation.
- Tc – Critical Temperature
- Pc – Critical Pressure
- TR – Reduced Temperature
- PR – Reduced Pressure
The Z factor for all gases is approximately the same at the same reduced temperature and pressure. This is called the principle of corresponding and data can be plotted to form a generalised compressibility chart (Figure 2) below.
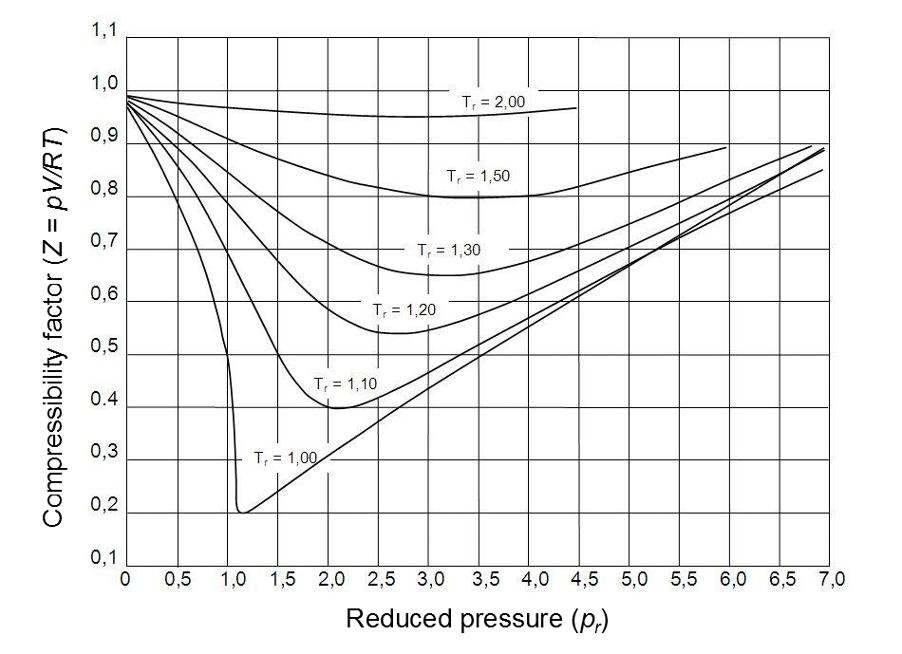
Figure 2: Generalised diagram of compressibility factor (Pugliesi, 2015).
- At low pressures (Pr << 1), gas behave like an ideal gas regardless of the temperature.
- At high temperature (Tr >> 2), ideal gas behaviour is assumed with god accuracy regardless of the pressure.
- The deviation from the ideal gas condition is greatest around the critical point.
All gases have a critical point, with the temperature, pressure and molar volume at the critical point being the critical constant. Above the critical temperature and pressure, gases behave as both liquid and gas (Figure 3).
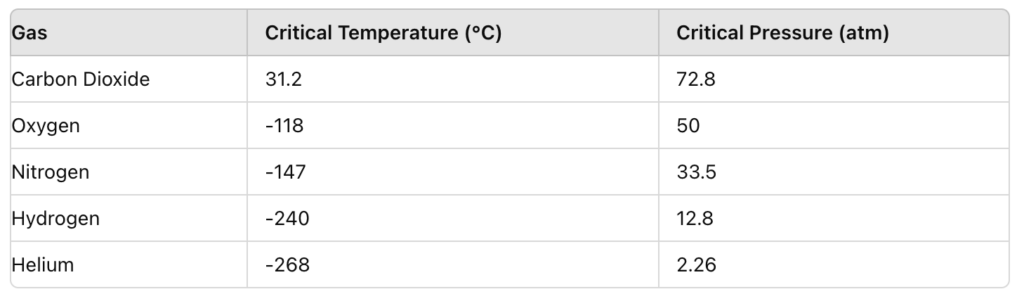
Figure 3: Gases and their critical properties (ScienceHQ, 2020).
The Van Der Waals Equation
Two parameters are derived from the molecule’s concepts, repulsion and attraction. First, assume the gas molecules are hard spheres to stress the actual volume available for the molecules (Equation 5):

Equation 5: Transformation of the ideal gas equation with the van der Waals ‘b’ term.
Where:
- a – Corrects for attractive forces between gas molecules
- b – Corrects for the finite volume of gas molecules
The pressure will depend on the frequency and the collision force between gas molecules and the walls of the vessel. As the molar volume decreases, the attractive forces between the molecules increases, thus leading to inverse proportionality (Equation 6):

Equation 6: Equation linking attractive forces and volume/molar volume.
References
Chemguide. (2024). Real gases. Retrieved from https://www.chemguide.co.uk/physical/kt/realgases.html
Pugliesi, D. (2015). File: Compressibility factor generalized diagram.png. Retrieved from Wikimedia Commons: https://commons.wikimedia.org/wiki/File:Compressibility_factor_generalized_diagram.png
ScienceHQ. (2020). Introduction to thermodynamics. Retrieved from ScienceHQ: http://www.sciencehq.com/physics/introduction-to-thermodynamics-2.html
Stack Exchange. (2019). Compressibility Factor Graph. Retrieved from Stack Exchange: https://chemistry.stackexchange.com/questions/107843/compressibility-factor-graph-which-gas-attains-a-deeper-minimum
Wikipedia. (2024). Real gases. Retrieved from https://en.wikipedia.org/wiki/Real_gas

Hassan graduated with a Master’s degree in Chemical Engineering from the University of Chester (UK). He currently works as a design engineering consultant for one of the largest engineering firms in the world along with being an associate member of the Institute of Chemical Engineers (IChemE).

