What Is Particle Size Distribution?
Particle size distribution (PSD) refers to the range and amount of different-sized particles in a sample, such as powder, granular material, or particles in a solution. This distribution is typically expressed by mass or length, showing the relative amounts of particles according to their sizes.
In practice, there are very large variations in particle sizes and distributions within a very broad range of physical and chemical properties and morphological properties of particles. Such variations are defined approximately by particle size, for example, particles less than a certain size class are either called micronised or milli-sized, those of a larger size class are called nano-sized or milli-sized, and those of other size ranges may be called micro-sized or mega-sized, or the like. The composition of a mixture of all sizes is given by its particle size distribution.
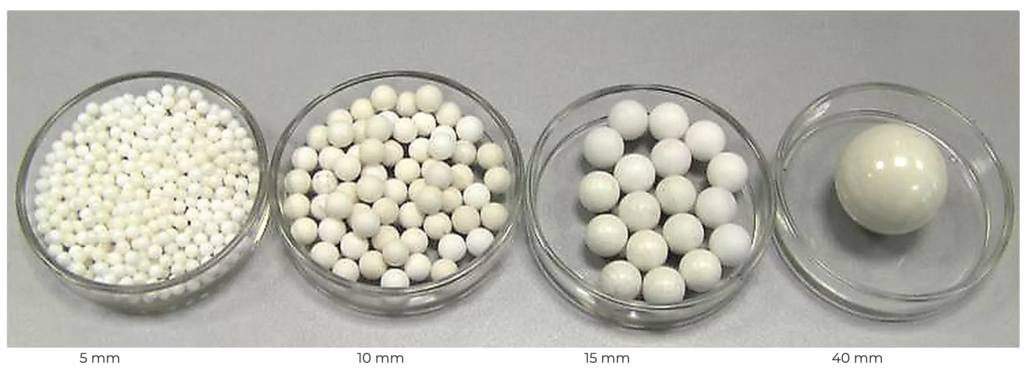
Figure 1: An image to show particle sizes (Microtrac, 2024)
Why Is Particle Size Distribution so Important?
PSD is crucial in quality control and research applications across various industries, such as pigments, ceramics, minerals, and pharmaceuticals. It influences material properties like flow behaviour, reactivity, solubility, compressibility, and even taste. Accurate PSD analysis is essential for product performance, quality, and functionality.
The functional form of a particle size distribution is often specified in a combined plot, such as cumulative distribution graph (graph 1), which shows the percentage difference for the size of each particle in a sample and a frequency distribution graph (graph 2) which shows the percentage of a sample corresponds to a given diameter.
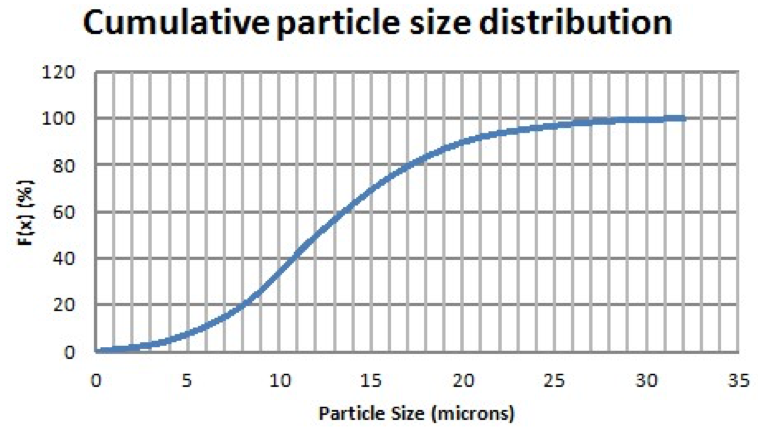
Graph 1: Cumulative Distribution (Process, 2020)
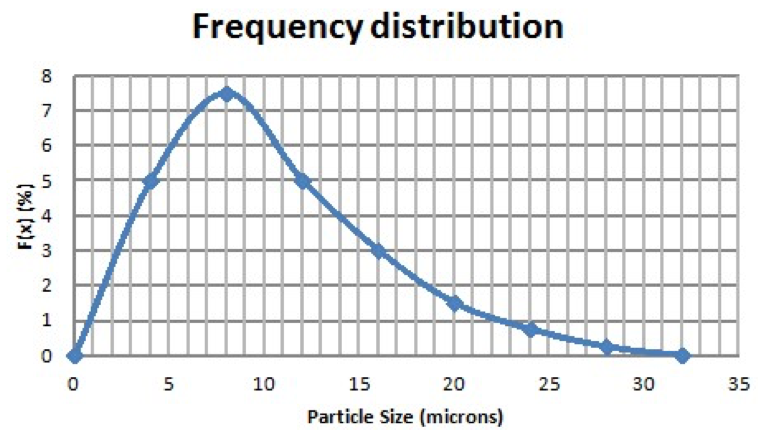
Graph 2: Frequency Distribution (Process, 2020)
The physical and biological properties of the particles within a sample can vary radically based on the sample’s particle size distribution. For instance, particle size analysis is used to characterise the nature and extent of the particulate matter or dust in the atmosphere. Particle size distributions can also develop into an important parameter in certain industries such as inorganic pigments, ceramics, minerals and pharmaceuticals.
Measuring Particle Size Distribution
There are numerous ways to measure a particulate sample’s size distribution, a common way is to use a light microscope.
Dynamic Light Scattering (DLS)
Figure 2: Dynamic Light Scattering (LS Instruments, 2024)
Dynamic Light Scattering (DLS) is a technique used to measure the size distribution of small particles, typically in the range of nanometers to micrometers, by analysing the fluctuations in the intensity of light scattered by particles in suspension. As particles move due to Brownian motion, these fluctuations provide information about their size. DLS is especially useful for characterising nanoparticles, emulsions, and other fine colloidal systems, offering a quick and non-invasive way to determine particle size based on their contribution to the overall scattering intensity.
Advantages of DLS
- Non-Invasive
- DLS is a gentle method that doesn’t require altering or damaging the sample, making it ideal for delicate particles like proteins and nanoparticles.
- Quick and Efficient
- The technique provides results quickly, often within minutes, making it suitable for rapid analysis in both research and industrial settings.
- Small Sample Size
- DLS requires only a small amount of sample, which is beneficial when dealing with limited or expensive materials.
- Wide Size Range
- DLS can measure particles ranging from a few nanometers up to a few micrometers, covering a broad range of applications.
Disadvantages of DLS
- Sensitivity to Large Particles
- The presence of even a few large particles or aggregates can skew the results, as larger particles scatter much more light, dominating the measurement.
- Requires Clear Solutions
- DLS works best with clear, dilute solutions. Any turbidity or high concentration can interfere with accurate measurements.
- Limited Information on Shape
- DLS primarily provides information about particle size, not shape. Particles of different shapes but similar sizes may produce similar scattering patterns.
- Complex Data Interpretation
- The data analysis can be complex, requiring sophisticated software and expertise to accurately interpret the results.
Applications of DLS in Industry
Dynamic Light Scattering is widely used across various industries due to its ability to accurately measure small particles. Here are some key applications:
- Pharmaceuticals
- DLS is used to analyse the size of drug particles and nanoparticles, which is critical for drug formulation, stability, and bioavailability.
- Biotechnology
- In biotechnology, DLS is employed to study proteins, antibodies, and other biological molecules. It helps in understanding their aggregation behaviour and stability, which is vital for developing therapeutics.
- Nanotechnology
- DLS is a fundamental tool in nanotechnology for characterising nanoparticles, liposomes, and other nanoscale materials. Understanding particle size distribution is crucial for optimising the properties and functionality of these materials.
- Food and Beverages
- The food industry uses DLS to study emulsions, such as those found in dressings and creams. It helps ensure product consistency and stability by monitoring particle sizes in suspensions.
- Cosmetics
- DLS helps in the formulation of cosmetic products by analysing the size of particles in creams, lotions, and other emulsions. This ensures product smoothness and texture.
- Environmental Monitoring
- DLS is used to measure particles in water and air, helping in the assessment of pollution levels and the effectiveness of filtration systems.
Laser Diffraction
Laser Diffraction is a widely used technique for measuring the size distribution of particles ranging from submicron to several millimetres in size. It works by passing a laser beam through a dispersed sample (either in liquid or air) and analysing the pattern of light scattered by the particles. The angle and intensity of the scattered light provide information about the size of the particles, with smaller particles scattering light at larger angles and larger particles scattering at smaller angles.
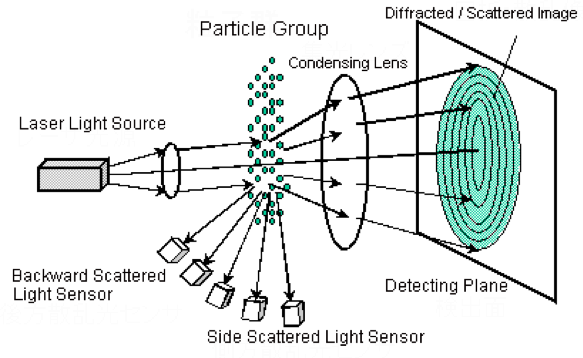
Figure 3: Particle size distribution laser diffraction (Shimadzu, 2020)
Advantages of Laser Diffraction
- Broad Size Range
- Laser Diffraction can measure particles across a wide size range, from nanometers to millimetres, making it versatile for many applications.
- Rapid Analysis
- The technique provides fast measurements, often in just a few seconds, allowing for high-throughput analysis in both research and industrial environments.
- High Reproducibility
- Laser Diffraction offers consistent and repeatable results, making it reliable for quality control and production processes.
- Non-Destructive
- The method is non-invasive, meaning that the sample is not altered or damaged during measurement, which is beneficial for sensitive materials.
- Ease of Use
- Modern laser diffraction instruments are user-friendly, with automated sample handling and analysis, making them accessible to non-specialists.
Disadvantages of Laser Diffraction
- Assumption of Particle Shape
- Laser Diffraction typically assumes that particles are spherical, which can lead to inaccuracies when measuring irregularly shaped particles.
- Sample Preparation Requirements
- Proper dispersion of the sample is imperative. Bad dispersion can lead to agglomeration or incomplete separation of particles, affecting the accuracy of the measurement.
- Limited Sensitivity to Very Small Particles
- While effective over a wide range, Laser Diffraction may struggle to accurately measure very small nanoparticles, particularly those below 100 nanometers.
- Complexity in Data Interpretation
- The interpretation of scattering patterns can be complex, requiring sophisticated software and a good understanding of particle size distribution theory.
Applications of Laser Diffraction in Industry
Laser Diffraction is a critical tool in various industries due to its ability to quickly and accurately measure particle size distributions. Here are some key applications:
- Pharmaceuticals
- Laser Diffraction is used extensively to measure the size distribution of drug powders, which is essential for ensuring proper dosage, stability, and bioavailability in formulations.
- Cement and Construction Materials
- In the construction industry, Laser Diffraction helps determine the particle size distribution of cement and other materials, which affects the strength, setting time, and durability of the final product.
- Food Industry
- This technique is used to analyse the size of particles in food products such as flour, sugar, and emulsions, helping to control texture, consistency, and quality.
- Chemical Industry
- Laser Diffraction is employed to monitor the particle size of pigments, resins, and other chemicals, ensuring uniformity and consistency in production processes.
- Minerals and Mining
- The method is crucial in the mining industry for analysing ore particles, which helps in optimising grinding processes and improving mineral recovery rates.
- Cosmetics
- Laser Diffraction is used to characterise particles in cosmetic powders and creams, influencing the feel, spreadability, and appearance of the final product.
- Environmental Monitoring
- The technique is applied in environmental science to measure particulate matter in air and water, contributing to pollution monitoring and control.
Sedimentation (Centrifuge Particle Size Analyser – CPSA)
Sedimentation using a Centrifuge Particle Size Analyser (CPSA) is a technique employed to measure the size distribution of particles, typically those larger than a few micrometers. The method is based on the principle that particles in a liquid medium settle at different rates depending on their size, shape, and density. Mass determined by this method can be used to calculate the volume distribution statistic, and the volume distribution itself can be further used to calculate the true geometric mean of the particle size distribution.
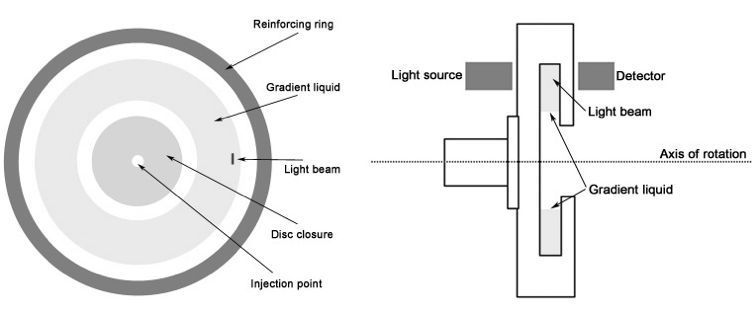
Figure 4: CPS Disc Centrifuge (Instruments, 2020)
Advantages of Sedimentation (CPSA)
- High Precision for Larger Particles
- CPSA is particularly effective for measuring larger particles (typically above 1 micron), providing high precision in size determination.
- Accurate Mass and Volume Distribution
- The technique provides detailed mass and volume-based size distributions, which are critical for many industrial applications where particle mass and volume impact product performance.
- Good for Polydisperse Samples
- CPSA is well-suited for analysing polydisperse systems (samples with a wide range of particle sizes), offering a clear view of the distribution across different size classes.
- Non-Destructive
- Like other non-invasive methods, sedimentation does not alter the sample during analysis, preserving the integrity of the particles.
Disadvantages of Sedimentation (CPSA)
- Time-Consuming
- The sedimentation process, even when accelerated by centrifugation, can be relatively slow compared to other particle sizing methods, making it less suitable for high-throughput applications.
- Limited to Larger Particles
- CPSA is not effective for analysing very small particles (e.g., nanoparticles), as these particles may settle too slowly or not at all, making them difficult to measure accurately.
- Requires Proper Dispersion
- Just like other particle sizing techniques, proper dispersion of the sample is crucial. Aggregation of particles can lead to inaccurate measurements.
- Influence of Particle Shape
- The settling rate can be influenced by the shape of the particles, potentially leading to errors if particles are not uniform in shape.
Applications of Sedimentation (CPSA) in Industry
Sedimentation using CPSA is utilised in various industries, particularly where the precise measurement of larger particles is essential. Here are some key applications:
- Pharmaceuticals
- In the pharmaceutical industry, CPSA is used to measure the size distribution of drug granules and excipients, which affects the dissolution rate, stability, and bioavailability of medications.
- Ceramics and Powders
- The ceramics industry relies on CPSA to analyse the size of powder particles used in the production of ceramics. Accurate particle sizing helps in controlling the properties of the final product, such as density and strength.
- Minerals and Mining
- CPSA is employed in the mining industry to analyse the size distribution of mineral particles. This information is crucial for optimising processes like grinding and flotation, which impact the efficiency of mineral recovery.
- Pigments and Coatings
- The pigment and coatings industry uses CPSA to ensure that particle size distributions meet specific requirements, influencing colour intensity, dispersion stability, and coating smoothness.
- Construction Materials
- In the construction industry, CPSA helps in analysing materials like cement and aggregates, where particle size distribution affects the workability, strength, and durability of the final product.
- Environmental Science
- CPSA is used in environmental monitoring to measure sediment particles in water bodies, helping to assess pollution levels and the effectiveness of filtration systems.
Optical Sizing Analyser (OSA)
An alternative method to measure a sample’s size distribution can be the Optical Sizing Analyser (OSA). The Optical Sizing Analyser (OSA) is a particle size analysis technique that measures the size distribution of particles by analysing the light they scatter or absorb as they pass through a light beam. This method is based on the principles of light refraction and diffraction, and it is particularly effective for determining the size of particles suspended in a liquid or dispersed in a gas. The OSA can measure a wide range of particle sizes, making it a versatile tool in various industries.
Figure 5: Optical Sizing Analyser (Interlab, 2020)
Advantages of Optical Sizing Analyser (OSA)
- Non-Destructive
- OSA does not alter or damage the particles during analysis, preserving the sample’s integrity, which is especially important for delicate or expensive materials.
- Wide Size Range
- The OSA can measure particles across a broad range, from submicron to millimetre sizes, making it suitable for many different applications.
- High Sensitivity
- This technique is sensitive enough to detect small differences in particle size, providing detailed information about the distribution of sizes in a sample.
- Real-Time Analysis
- OSA can provide real-time measurements, which is beneficial for continuous monitoring in industrial processes and for immediate quality control.
- Versatile
- OSA can handle different types of samples, including liquids, gases, and dry powders, making it a versatile tool across various industries.
Disadvantages of Optical Sizing Analyser (OSA)
- Sample Preparation Requirements
- Proper sample preparation is critical to ensure accurate measurements. Poor dispersion or incorrect concentration can lead to inaccurate results.
- Assumption of Particle Shape
- OSA typically assumes that particles are spherical, which may lead to inaccuracies when measuring particles with irregular shapes.
- Cost
- The equipment and maintenance for OSA can be expensive, making it less accessible for smaller laboratories or industries with limited budgets.
- Complex Data Interpretation
- The interpretation of results from an OSA can be complex, often requiring specialised software and expert knowledge to accurately analyse the data.
Applications of Optical Sizing Analyser (OSA) in Industry
The Optical Sizing Analyser is used in a variety of industries due to its ability to measure particle sizes accurately and efficiently. Here are some key applications:
- Pharmaceuticals
- OSA is used to determine the size distribution of particles in drug formulations, which affects the drug’s dissolution rate, bioavailability, and stability. This ensures that the pharmaceutical products meet the required standards for safety and efficacy.
- Food and Beverages
- In the food industry, OSA is employed to analyse particles in emulsions, suspensions, and powders, helping to control texture, consistency, and stability of products like sauces, dressings, and beverages.
- Cosmetics
- The cosmetics industry uses OSA to measure the size of particles in creams, lotions, and powders, which influences the product’s texture, application, and appearance on the skin.
- Chemicals and Polymers
- OSA is essential in the chemical industry for analysing the particle size distribution in pigments, polymers, and resins, which impacts the colour, dispersion, and overall quality of the final product.
- Environmental Monitoring
- OSA is used to measure particulate matter in air and water samples, contributing to environmental monitoring and pollution control efforts. It helps in assessing the effectiveness of filtration systems and the impact of pollutants.
- Mining and Minerals
- In the mining industry, OSA is used to analyse the size distribution of mineral particles, which is critical for optimising processes like grinding, sorting, and flotation, improving the efficiency and yield of mineral extraction.
- Paints and Coatings
- The size of particles in paints and coatings affects their application properties, such as smoothness, gloss, and drying time. OSA is used to ensure that the particle size distribution meets the desired specifications.
Sieve Analysis
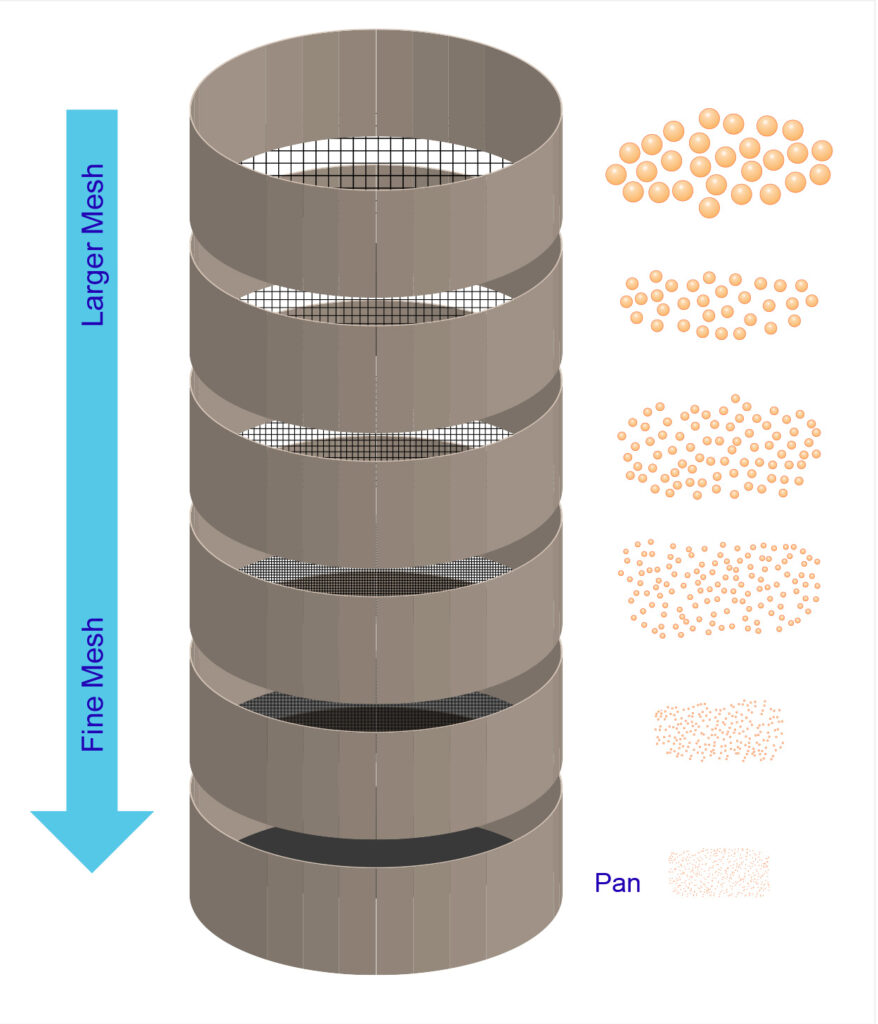
Figure 6: Sieve Analysis (Particletechlabs, 2024)
Sieve Analysis is a classic and widely used technique for determining the particle size distribution of a granular material. This method involves passing a sample through a stack of sieves with progressively smaller mesh sizes, separating the particles into different size fractions. The mass of particles retained on each sieve is then measured, providing a straightforward way to quantify the distribution of particle sizes in the sample. Sieve Analysis is especially useful for larger particles, typically those above 45 micrometers.
Advantages of Sieve Analysis
- Simplicity and Accessibility
- Sieve Analysis is a straightforward, easy-to-understand method that requires minimal training and can be performed with relatively inexpensive equipment, allowing it to be accessible to all areas of the world.
- Robustness
- The method is robust and can be used for a wide range of materials, including powders, granules, and aggregates, making it versatile across different industries.
- Direct Measurement
- Sieve Analysis provides a direct measurement of particle size distribution by physically separating particles, offering clear and tangible results.
- Wide Application Range
- It is applicable to a wide variety of materials, particularly those with larger particle sizes, such as soil, sand, cement, and other construction materials.
- No Assumption of Particle Shape
- Unlike some other methods, Sieve Analysis does not rely on assumptions about particle shape, making it effective for irregularly shaped particles.
Disadvantages of Sieve Analysis
- Limited Precision for Fine Particles
- Sieve Analysis is less effective for very fine particles (typically below 45 micrometers), as they may pass through the sieve meshes irregularly or agglomerate, leading to inaccurate results.
- Labor-Intensive
- The process can be labour-intensive, especially for large sample sizes or when multiple fractions are required. It also requires careful handling to avoid sample loss.
- Time-Consuming
- Depending on the sample and the number of sieves used, the process can be time-consuming, especially when compared to automated methods like laser diffraction.
- Potential for Sieve Wear
- The sieves themselves can wear out over time, particularly when working with abrasive materials, which can affect the accuracy of the results and necessitate regular maintenance and replacement.
Applications of Sieve Analysis in Industry
Sieve Analysis is employed across numerous industries due to its effectiveness in measuring particle size distribution in larger particles. Here are some key applications:
- Construction Materials
- In the construction industry, Sieve Analysis is crucial for grading aggregates, sand, and cement. The particle size distribution impacts the strength, durability, and workability of concrete and asphalt mixtures.
- Mining and Minerals
- The mining industry uses Sieve Analysis to determine the particle size distribution of ores and minerals, which is essential for optimising the grinding process and improving mineral recovery.
- Agriculture
- Sieve Analysis is used to analyse soil composition, helping to determine soil texture, which affects water retention, aeration, and fertility.
- Food Industry
- In the food industry, Sieve Analysis is used to ensure uniformity in particle size for products like flour, sugar, and spices, which is important for consistency in texture, taste, and processing behaviour.
- Pharmaceuticals
- Sieve Analysis is used to classify granules and powders, which is critical in ensuring consistent dosing, flowability, and compressibility in tablet formulation.
- Environmental Science
- Sieve Analysis is employed in environmental science to analyse soil and sediment samples, helping to assess erosion patterns, sediment transport, and soil fertility.
- Chemical Industry
- The chemical industry uses Sieve Analysis to determine the particle size distribution of raw materials and finished products, which affects the reactivity, solubility, and quality of chemical formulations.
Dynamic Image Analysis (DIA)
Dynamic Image Analysis (DIA) is an advanced technique used to measure the size and shape distribution of particles by capturing and analysing high-speed images of particles as they flow through a detection area. Unlike traditional methods that only provide information on particle size, DIA offers detailed insights into the shape, aspect ratio, and morphology of particles, making it a powerful tool for comprehensive particle characterisation. This method is particularly useful for analysing particles ranging from a few micrometers to several millimetres in size.
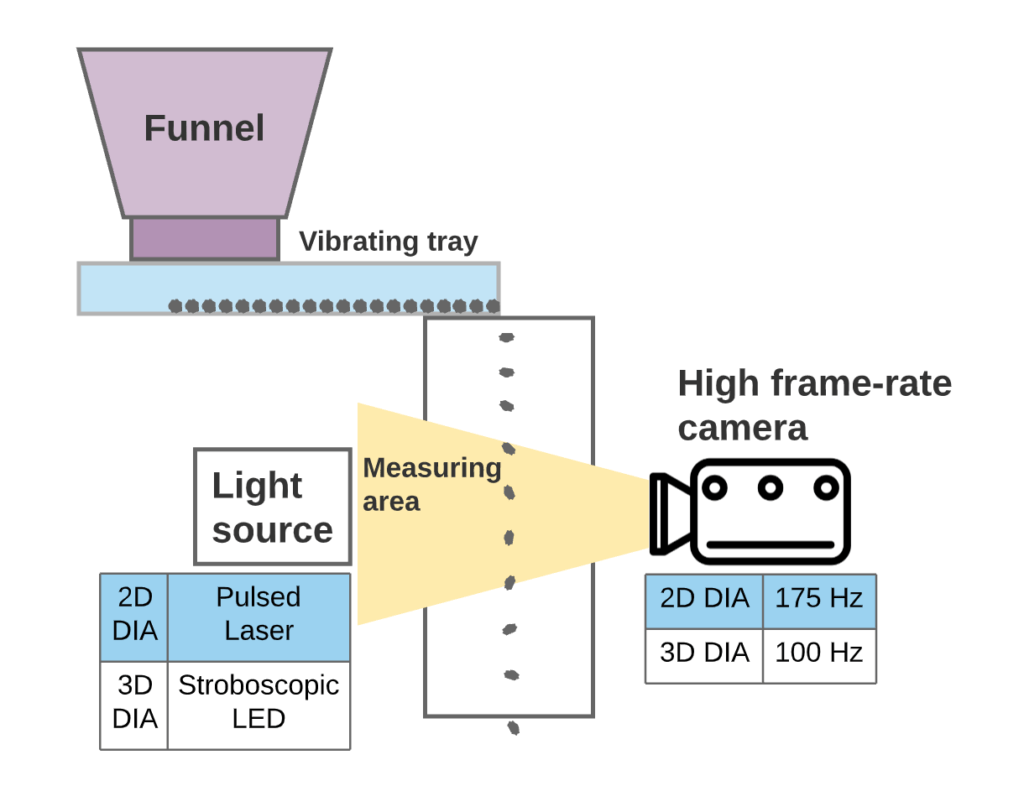
Figure 7: Schematic diagram of Dynamic Image Analysis (DIA). A Sympatec QICPIC® was employed for 2D DIA analysis and a Microtrac PartAn3D® was employed for 3D DIA analysis (wp.nyu.edu, 2024)
Advantages of Dynamic Image Analysis (DIA)
- Detailed Particle Shape Information
- DIA provides not only particle size but also detailed shape characteristics, such as elongation, roundness, and aspect ratio, which are crucial for understanding the behaviour and functionality of particles.
- Real-Time Analysis
- DIA offers real-time data acquisition and analysis, allowing for immediate feedback during processing or quality control operations.
- Versatile Measurement Range
- DIA can measure a wide range of particle sizes, from a few micrometers to several millimetres, making it suitable for diverse applications across different industries.
- Non-Destructive
- The technique does not alter or damage the sample, preserving the integrity of the particles for further analysis or processing.
- High Throughput
- DIA can process a large number of particles quickly, making it ideal for high-throughput applications where large sample volumes need to be analysed rapidly.
- Comprehensive Data
- DIA provides comprehensive data on particle size distribution, shape, and morphology, enabling a deeper understanding of the sample’s characteristics.
Disadvantages of Dynamic Image Analysis (DIA)
- Complex Data Interpretation
- The amount of data generated by DIA, particularly regarding particle shape, can be complex to interpret and may require advanced software and expertise.
- Higher Cost
- DIA systems can be expensive, both in terms of initial investment and maintenance, potentially limiting their accessibility for smaller laboratories or industries.
- Sample Preparation Requirements
- Proper dispersion of the sample is essential to avoid overlapping particles, which can complicate image analysis and lead to inaccurate measurements.
- Limited for Extremely Fine Particles
- While DIA is effective for a broad range of sizes, it may be less accurate for extremely fine particles, particularly those below a few micrometers.
Applications of Dynamic Image Analysis (DIA) in Industry
Dynamic Image Analysis is used across various industries due to its ability to provide detailed and comprehensive particle characterisation. Here are some key applications:
- Pharmaceuticals
- In the pharmaceutical industry, DIA is used to analyse the size and shape of granules, powders, and crystals, which are critical for ensuring consistent drug formulation, dissolution rates, and bioavailability.
- Mining and Minerals
- The mining industry employs DIA to characterise ore particles, helping to optimise grinding and separation processes, which enhances mineral recovery and processing efficiency.
- Food and Beverages
- DIA is used in the food industry to analyse particles in products such as flour, sugar, and emulsions. Understanding particle size and shape helps control texture, consistency, and product stability.
- Cosmetics
- The cosmetics industry uses DIA to measure and analyse particles in powders, creams, and lotions. The size and shape of particles impact the texture, application, and appearance of cosmetic products.
- Chemicals and Polymers
- In the chemical industry, DIA is employed to analyse the particle size and shape of raw materials and finished products, which affects the flow properties, reactivity, and quality of chemical formulations.
- Construction Materials
- DIA is used to analyse aggregates, cement, and other construction materials. The particle size and shape distribution influence the strength, durability, and workability of concrete and other building materials.
- Environmental Science
- DIA is applied in environmental science to analyse soil, sediment, and particulate matter in air and water samples. It helps assess pollution levels, sediment transport, and soil fertility.
Why Measure PSD?
The ability to measure particle size distributions is critical to the many different industries and applications. Although there are many ways to adequately find this data, each involving different costs, some are more efficient than others. Usually, through a complex method involving laser diffraction, the particle size distribution can be got from one pellet. This pellet is usually made up of 2000 samples of 50 particles each. A simpler, but much more expensive, the method is to use the OSA. The sedimentation method is the quickest and most accurate way to obtain the size distribution of a sample.
As previously mentioned, particle size distribution is a very important aspect in almost every industry and is a representation of how one specific sample differs from others in terms of particle sizes. This is important in knowing how to select the correct particles for a specific function. For instance, in pharmaceuticals having the particles of a certain size is important when it comes to the performance and appropriateness of drug formulation.
Key Parameters from PSD Analysis
- Percentiles (d10, d50, d90)
- These values indicate the size below which 10%, 50%, or 90% of the particles fall. They are crucial for understanding the spread of particle sizes within a sample.
- Mean Particle Size
- Calculated by averaging the sizes within each measurement class, weighted by the quantity in each class.
- Distribution Width
- The spread of particle sizes, often expressed as standard deviation or span value (d90 – d10) / d50.
- Mode Size
- The most frequently occurring particle size in the distribution.
- Monomodal vs. Bimodal Distributions
- A monomodal distribution has a single peak, while bimodal (or multimodal) distributions have multiple peaks, indicating different dominant particle sizes.
- Oversize and Undersize Particles
- These are particles significantly larger or smaller than the bulk of the sample, often identified by steps in the cumulative curve or additional peaks in the density distribution.
References
Instruments, C. (2020). CPS Disc Centrifuge. Retrieved from CPS Instruments Europe: http://www.cpsinstruments.eu/pdf/General%20Brochure.pdf
Interlab. (2020). Optical Spectrum Analyzer. Retrieved from Interlab: https://www.interlab.pl/en/product/optical-spectrum-analyzer.html
LS Instruments. (2024). Dynamic Light Scattering (DLS). Retrieved from LS Instruments: https://lsinstruments.ch/en/theory/dynamic-light-scattering-dls/introduction
Microtrac. (2024). Analysis of Particle Size Distribution. Retrieved from Microtrac: https://www.microtrac.com/knowledge/particle-size-distribution/
Particletechlabs. (2024). Sieve Analysis. Retrieved from Particletechlabs: https://particletechlabs.com/wp-content/uploads/2022/10/Sieve_Analysis.jpg
Process, P. (2020). Particle Size Distribution (PSD). Retrieved from Powder Process: https://www.powderprocess.net/psd.html
Shimadzu. (2020). Particle Size Distribution Calculation Method. Retrieved from Shimadzu: https://www.shimadzu.com/an/powder/support/practice/p01/lesson22.html
WP.NYU.EDU. (2024). Dynamic Image Analysis. Retrieved from WP NYU EDU: https://wp.nyu.edu/dia/

Dr. Adam Zaidi, PhD, is a researcher at The University of Manchester (UK). His doctoral research focuses on reducing carbon dioxide emissions in hydrogen production processes. Adam’s expertise includes process scale-up and material development.’