Non Isothermal Reactors
Firstly, we will be taking a look into energy balances on reactors to give us a better understanding of the equations and assumptions used in the Non-Isothermal and Non-Ideal Flow reactors. The First 2 terms that need to be understood are, Isothermal and Adiabatic.
What Does Isothermal Mean?
Isothermal which refers to a system at a constant temperature,
What Does Adiabatic Mean?
Adiabatic involves no heat entering or leaving the system.
What Is An Open System?
Open systems refers to mass being able to enter and leave the system. Moreover, Temperature can also be lost to or gained from the surrounding.
What Is An Energy Balance?
An Energy balance is simply the difference in the energy input and output. An energy balance equation can be used on open systems and can be relatively easy to do or challenging when more components and different phases are present.
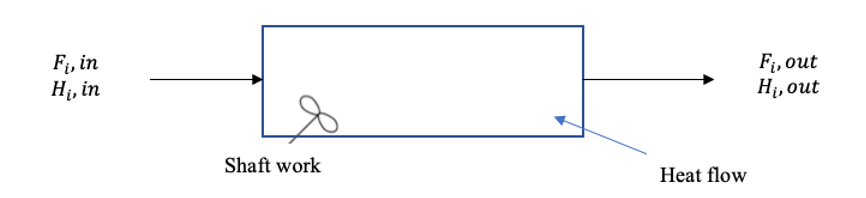
The energy balance equation for an open system is:
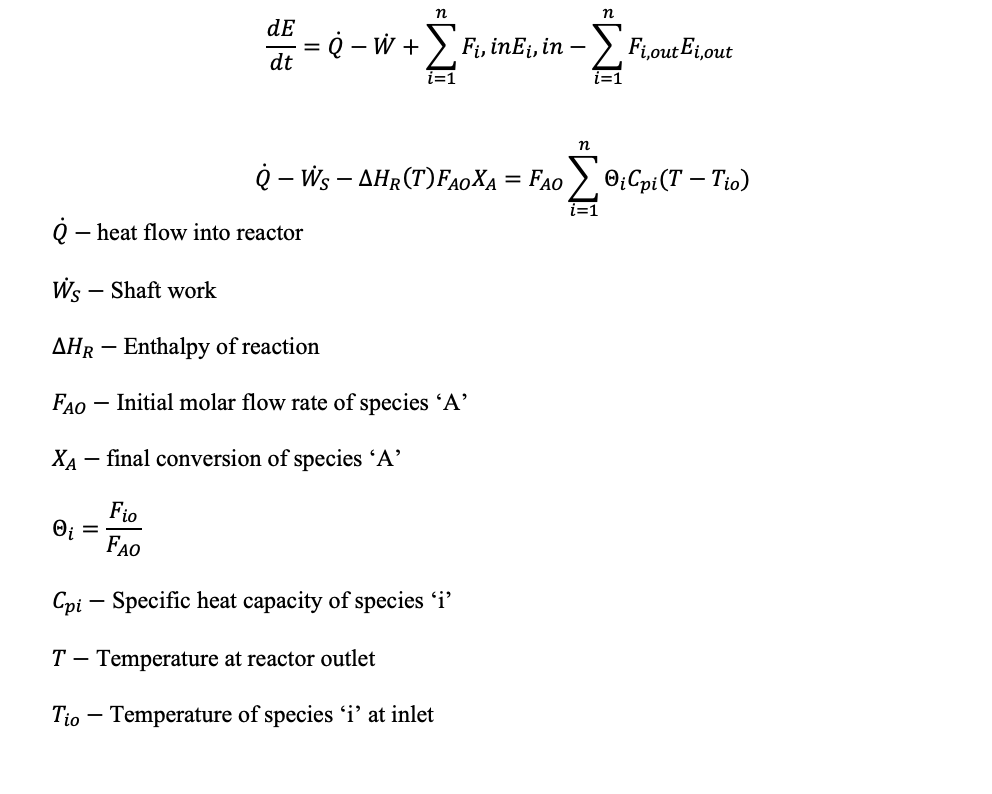
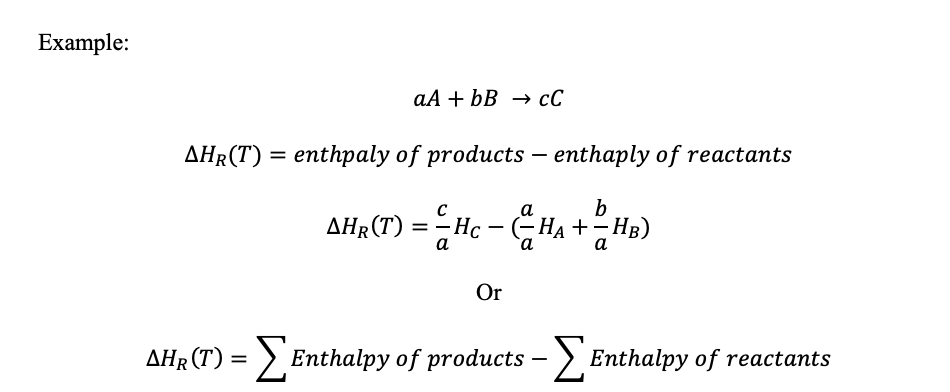
The enthalpy of reaction at a certain temperature (T) is worked out using the enthalpy of products and reactants:
Non-Ideal Flow Reactors
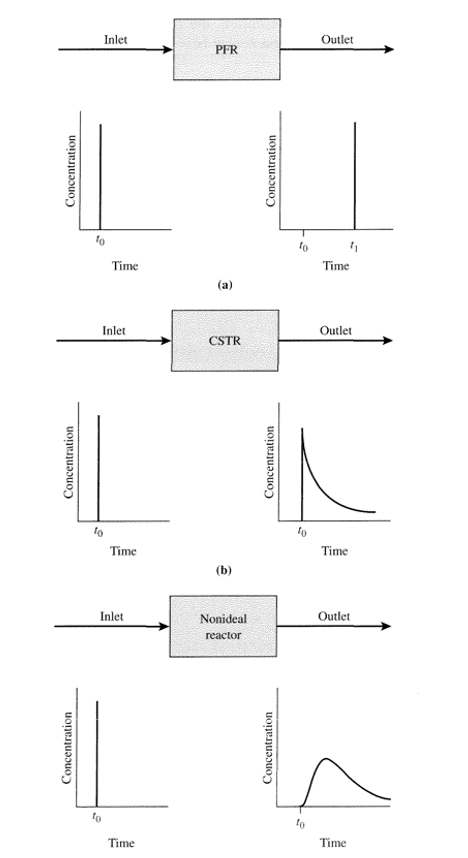
In reality reactors can never be ideal and it cannot be assumed. The flow will always deviate and for flow reactors, non-ideal flow patterns can cause issues.
CSTR (Continuous stirred-tank reactor):
- There will be stagnant or dead regions where no mixing of fluids and no flow. This causes the fluid to sit in place and reduce the volume of the CSTR for reactions.
- In the event where the fluids flow from the inlet to the outlet, this is called short-circuiting and the fluid won’t mix or spend enough time in the reactor.
PFR (Plug Flow Reactor):
- The ideal plug flow isn’t possible in reality as fluids will mix along the length of the PFR.
- Fluids closer to the walls will travel at a slower rate than fluid closer to the centre of the reactor and this will cause mixing along the axis of PFR.
- Turbulent mixing and molecular diffusion will lead to mixing along the length of the PFR.
What Is Residence Time Distribution and How To Calculate Residence Time Distribution
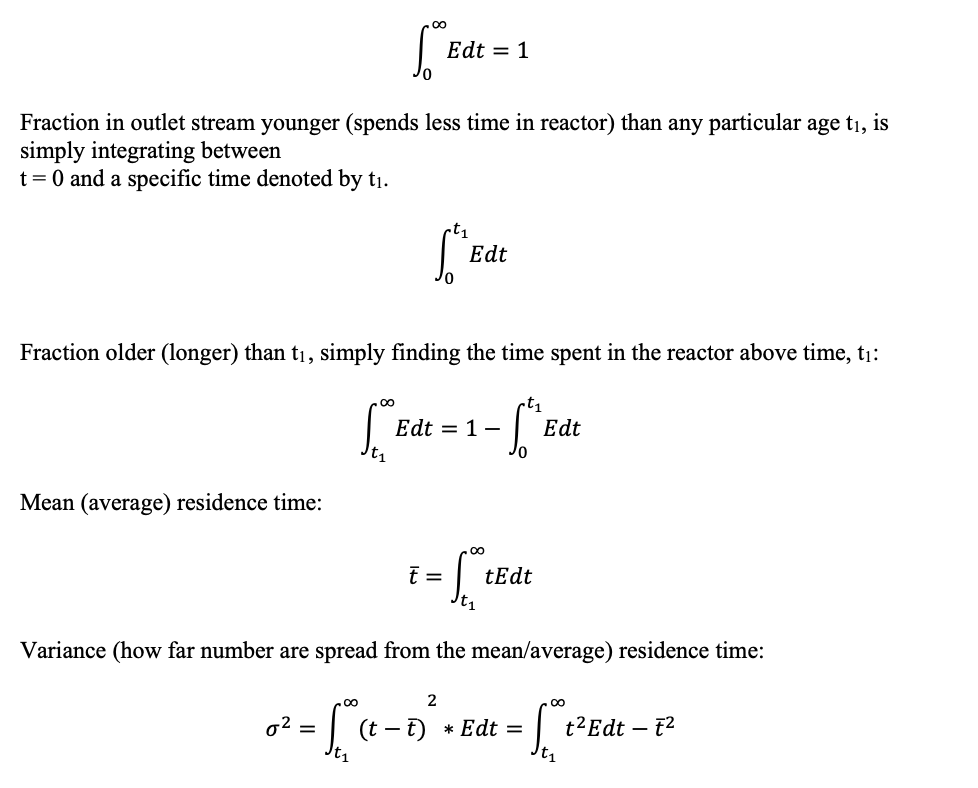
Residence time distribution (RTD) is the probability distribution of the time that a solid or fluid spends inside the reactor and is the main method that can be measured to understand the types of flow encountered in non-ideal flow reactors. TRD is denoted with the symbol, E and will tell us the amount of time (age) the material spends in the exit stream of the reactor.
t – age. It is time spent in reactor, you will find that age young and older as used to denote time, as long as you remember that age is time spent in reactor. The terms younger and older are the same. They are seen as as less time spent in the reactor (younger) and More time spent in the reactor (older).
the RTD is normalised to unity (integrated between zero and infinity):
How To Measure The Residence Time Distribution
The RTD is measured using the pulse experiment, which involves injecting a pulse dye or tracer dye into the fluid before entering the reactor, then measuring the dye concentration over a period of time and the results when graphed will be normalised. The concentration is proportional to the RTD and gives an area under the graph of unity (1).
You will need to divide the measured concentration curve, Cpulse by the area under the curve. The area under the graph can be found by integration or by the expression M/ (mass of tracer/volumetric flow rate) assuming that Cpulse is mass per unit volume.
Example Residence Time Distribution
Step experiment and F curve:
Here we have a steady yellow tracer flow at t = 0. The tracer concentration at the outlet will increase as time increases, Cstep will equal the inlet concentration. This concentration divided by the final concentration is called the F curve. The final concentration of the tracer is mass flow rate divided by volumetric flow rate.
We can now say that at any time greater than t = 0, that the yellow tracer in the exit stream is younger than age t, and the fraction of yellow tracer at the outlet is equal to the fraction of the exit stream younger than time t, which is written as:

State Of Mixing and RTD:
To find out the conversion of the reactants the state of mixing as well as the RTD need to be known. There are two terms we describe the state of mixing:
The State of Mixing | Macrofluid and Microfluid:
- Macrofluid: Globules of fluids act as their own batch reactors and will spend different amounts of time in the reactor and have a different conversions than other globules. Also, o mixing between globules of fluid that aren’t the same age, such as very viscous fluids or solids.
- Microfluid: Individual globules can move anywhere in the reactor such as an ideal CSTR, examples of these include gases and not very viscous liquids.
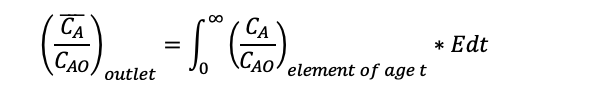
For batch reactors, to work out the concentration of a species let’s call it A for an element of age t and average using the RTD the equation would be:

Hassan graduated with a Master’s degree in Chemical Engineering from the University of Chester (UK). He currently works as a design engineering consultant for one of the largest engineering firms in the world along with being an associate member of the Institute of Chemical Engineers (IChemE).